
The main measure of income inequality – the Gini coefficient – reached its highest level in Russia since 2007. From the perspective of the authorities in the Kremlin, however, the results look entirely different: Rosstat changed its methodology for calculating inequality by taking taxes and regional cost differences into account. As a result, the figures now come as close as possible to the inequality target set by Vladimir Putin for 2030, even if the actual gap between rich and poor has not actually narrowed.
Two Ginis in one bottle
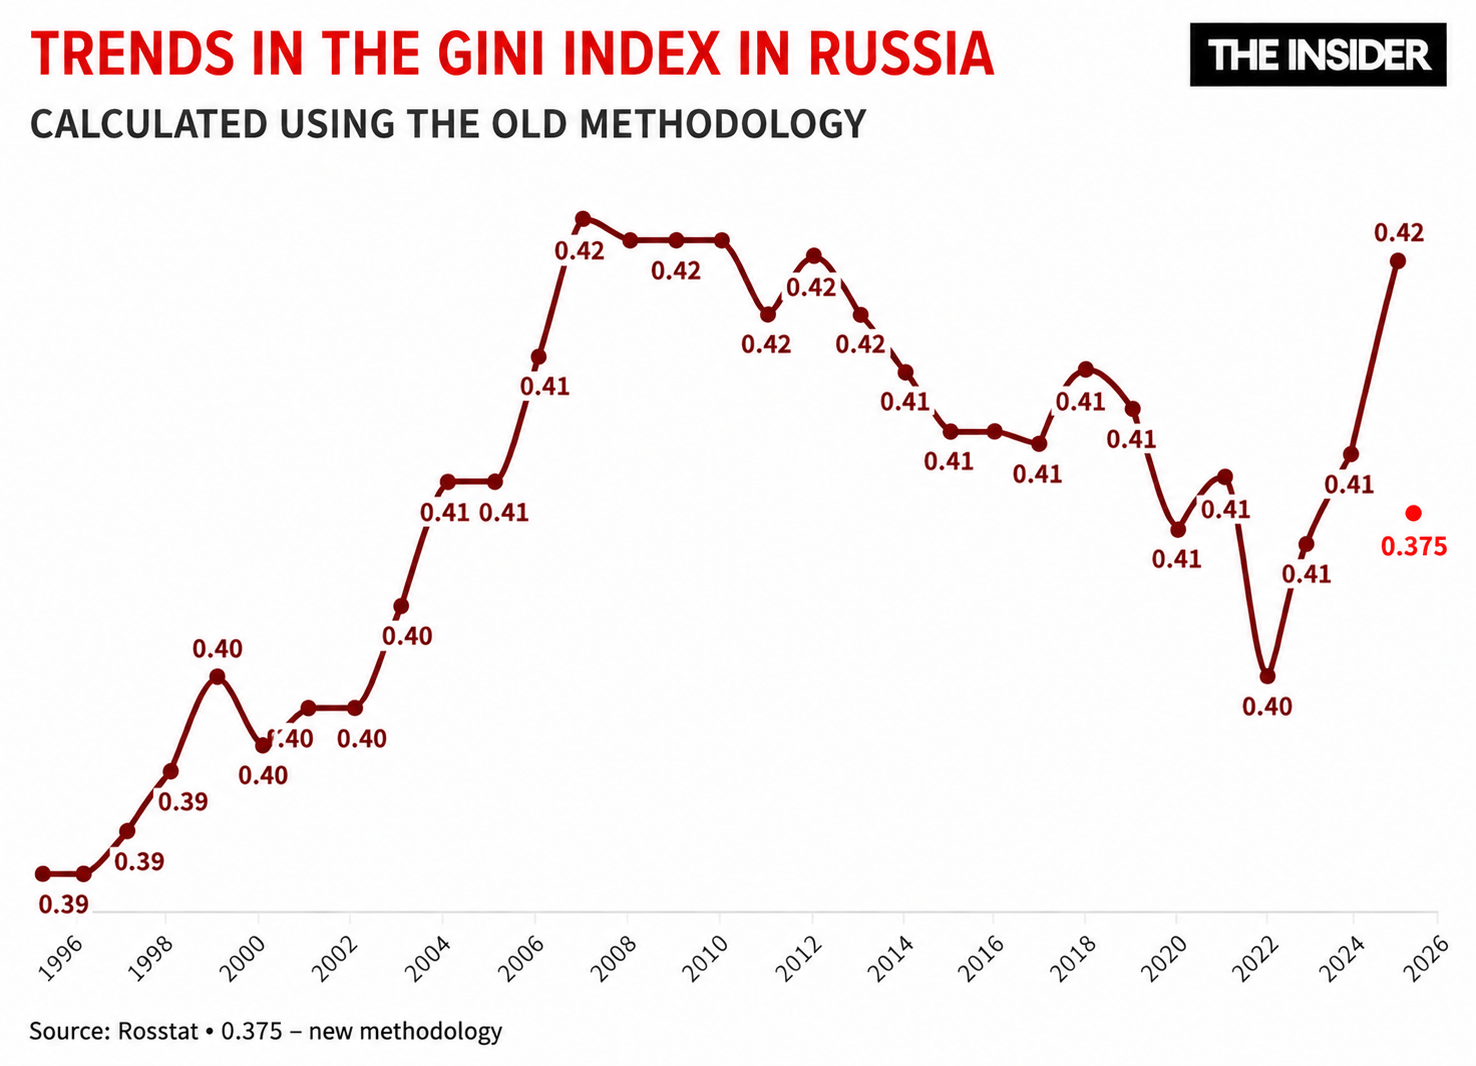
Inequality in Russia has been rising for a third consecutive year. In 2025, the incomes of the richest 10% exceeded those of the poorest 10% by nearly 17 times. Meanwhile, the main indicator – the Gini coefficient – reached 0.422, pointing to deep social stratification.
Rosstat did not publish this result immediately. In March, it removed the Gini index from its annual report without explanation. Then, a month later, it announced a new methodology while releasing both indicators at once. The new figure turned out to be much lower – 0.375 – and, incidentally, almost exactly at the target that a decree issued by Vladimir Putin in 2024 had set for 2030 (0.37).
Until now, Rosstat had calculated the Gini coefficient using the classical methodology employed worldwide. The principle is simple: the pre-tax incomes of all citizens are taken into account, people are ranked from the poorest to the richest, and the degree of income inequality is then calculated mathematically. This method does not consider how much tax a person actually paid – even though the wealthy in Russia now pay more even in percentage terms – nor does it account for the fact that the same amount of money can buy more in one region than in another.
Under the Kremlin’s new version, on the other hand, taxes are taken into account. Instead of gross income, the calculation uses the amount remaining after taxes, pensions, and social benefits are taken into account. Since Russia introduced a progressive tax system in 2025 and low-income groups receive various deductions, the gap narrows mathematically.
Regional prices have also been added to the calculation, meaning that the purchasing power differences between, for example, Moscow and Lipetsk, are factored in. In short, incomes in wealthier regions are “brought closer” to the average.
The result is a gap of 0.047 points between the two methodologies for the same year. Under the classical methodology, the coefficient increased by 0.012 points between 2024 and 2025. However, the new calculation method made it possible to “improve” the indicator by an amount that would have taken upwards of four years to achieve via actual efforts to decrease the level of inequality nationwide.
Rosstat has not abandoned the classical calculation, and it continues to publish both figures. The question is which number will be used in official reports and in assessing the implementation of the May Decrees.
The origins of the new methodology can be found at Moscow’s Higher School of Economics. In April, its experts presented their calculation method in a report titled “Regional Estimates of Income Inequality Based on Tax Statistics and Microdata from Income Surveys.” They proposed combining Rosstat’s sample survey data with regional Federal Tax Service data on income from employment, self-employment, and property.
As expected, the new formula produced a lower result: in 2023, according to HSE calculations, the Gini coefficient stood at 0.38, whereas Rosstat’s official figure under the classical Gini methodology was 0.405. Of course, the internationally recognized Gini coefficient has a strict calculation algorithm, and by altering it, Rosstat is effectively producing a different indicator.
The Gini coefficient has a strict calculation algorithm, and by changing it, Rosstat is effectively producing a different indicator
Why does this matter? Putin’s May 2024 decree explicitly sets a goal of reducing the Gini coefficient to 0.37 by 2030. Under the classical calculation, that goal appears unattainable, as the index for Russia is not only high, but has been rising since 2023.
The new methodology solves the problem elegantly: without changing reality, the authorities can change the measuring stick. Under the revised data, the figure of 0.375 is already almost at the target level of 0.37. The task is practically achieved.
By contrast, under the classical methodology, the coefficient rose from 0.405 to 0.422 over the past three years. If that trend continues, it would reach 0.458 by 2030 – far above the target.
Why the new methodology does not reflect reality
As with poverty statistics, changing the methodology for calculating the Gini index makes it possible to show “improvement” without any real change in citizens’ wellbeing. At first glance, taking taxes and regional prices into account may seem like a step forward, but the wealthy earn many times more than the poor do before taxes, and no progressive tax scale, however steep, can eliminate that gap.
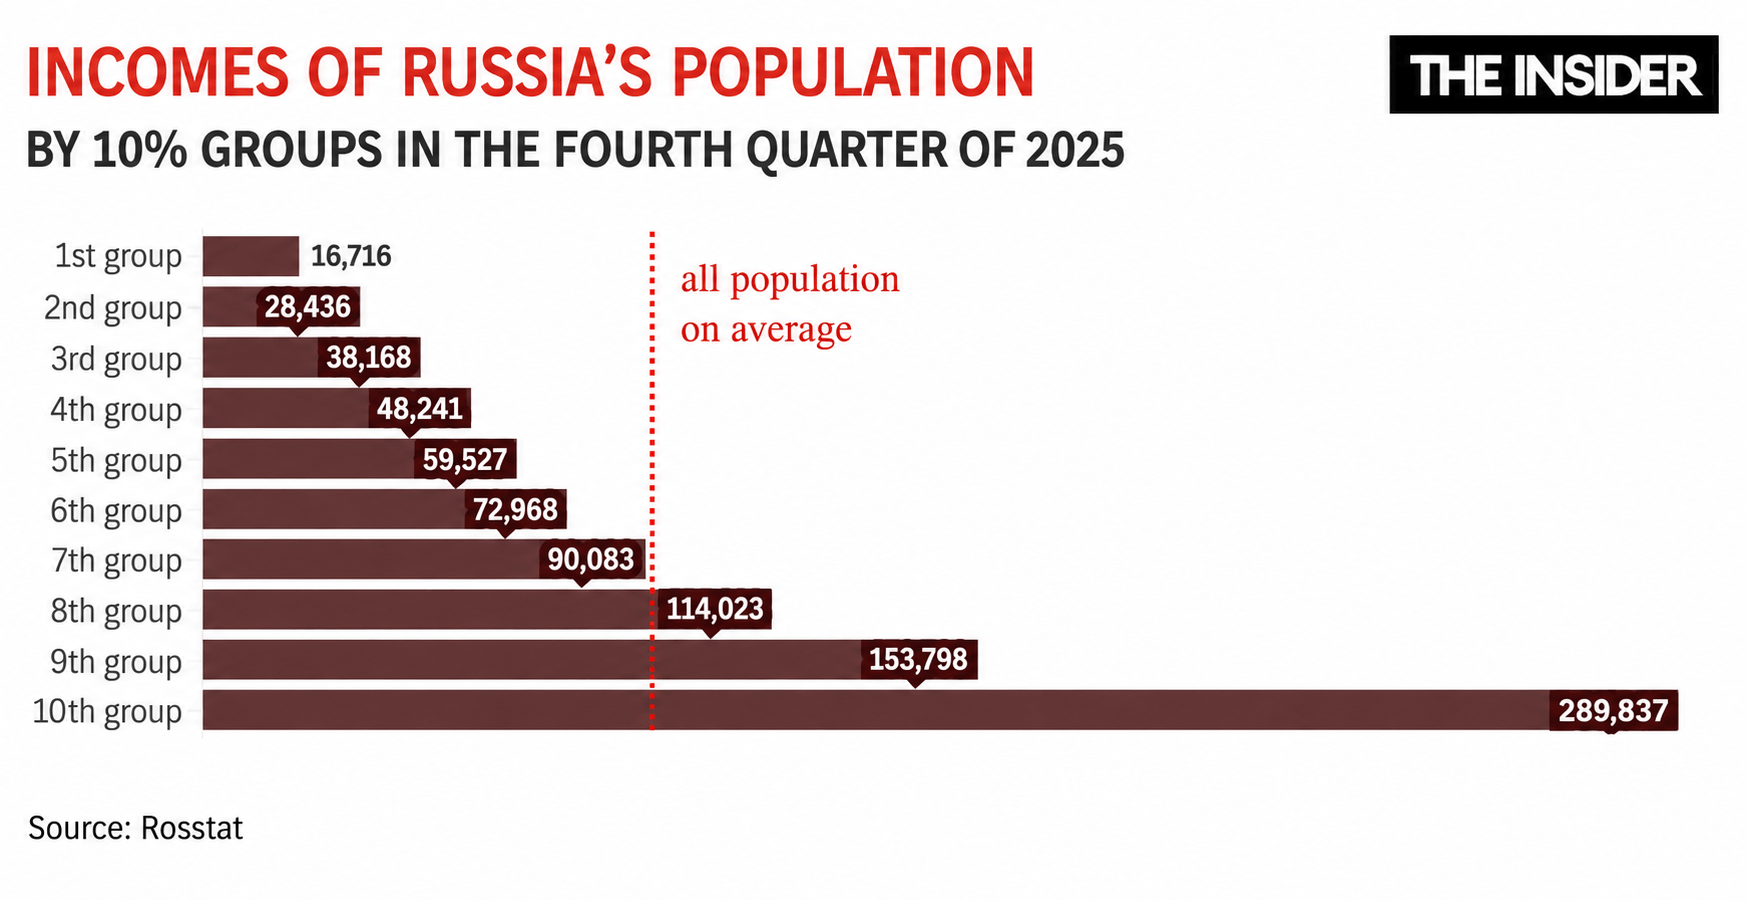
According to Rosstat’s own data, the average monthly income of the richest 10% of Russians in the fourth quarter of 2025 was 289,800 rubles. The average income of the poorest 10% was 16,700 rubles — a 17-fold difference. After taxes are paid and transfers are received, the gap narrows, but it still remains enormous.
Changing the methodology for calculating the Gini index makes it possible to show “improvement” without any real changes in citizens’ incomes
Taking into account regional prices is also a questionable innovation. The prices of bread, milk, and medicines do not differ across most regions as dramatically as the adjustment implies. More importantly, poor people already live in low-income regions, and taking regional prices into account does not increase their purchasing power. The formula that “the same amount of money buys more in a village than in Moscow” works only for those who actually have the money to spend on luxuries. Poor people simply do not, meaning that in all regions they can afford roughly the same minimal basket of goods and services.
Again, the methodology has changed, but people have not become richer. If someone earned 20,000 rubles a month before, they still earn 20,000 after the new calculation was introduced. Neither the tax reform nor the “regional coefficient” has put additional money in their pocket.
Thus, the new methodology is not an “improvement in statistics” but a change in the measuring instrument itself, one that makes it possible to present target indicators without altering the real state of affairs. This is exactly the same logic that was applied to the “poverty line” in 2021: change the definition and the desired result appears.
Contrary to official claims that inequality is declining, an analysis of Rosstat data shows the opposite. In 2025, wealthy Russians were getting richer much faster than the poor, and the gap between them continued to widen.
If one looks at the distribution of all monetary income in the country, it becomes clear that income is shifting toward the wealthy. In 2025, the richest 10% of Russians accounted for 30.8% of all income, up from 30.3% a year earlier. At the same time, the share received by the poorest 10% remained unchanged at just 1.9%.
Experts point to two main reasons for the accelerating stratification. The first factor is high interest rates. The Central Bank’s tight monetary policy has boosted income from bank deposits and financial assets, benefiting primarily those who already have savings – that is, more affluent citizens. Second, wage growth has been uneven across sectors, and salaries in high-paying industries are rising faster than those in the public sector, where many of Russia’s poorest work.
How else can inequality be measured?
The income-based Gini index is not the only way to measure inequality. There is also consumption data, which measures how much money different population groups actually spend. These figures show lower levels of inequality. According to a Bank of Russia survey conducted in 2024 – the most recent study it published – median monthly spending per person among the poorest 10% of households amounted to 13,094 rubles, compared with 52,633 rubles among the wealthiest 10% — a fourfold gap. In terms of income, the gap for the same groups is sixfold.
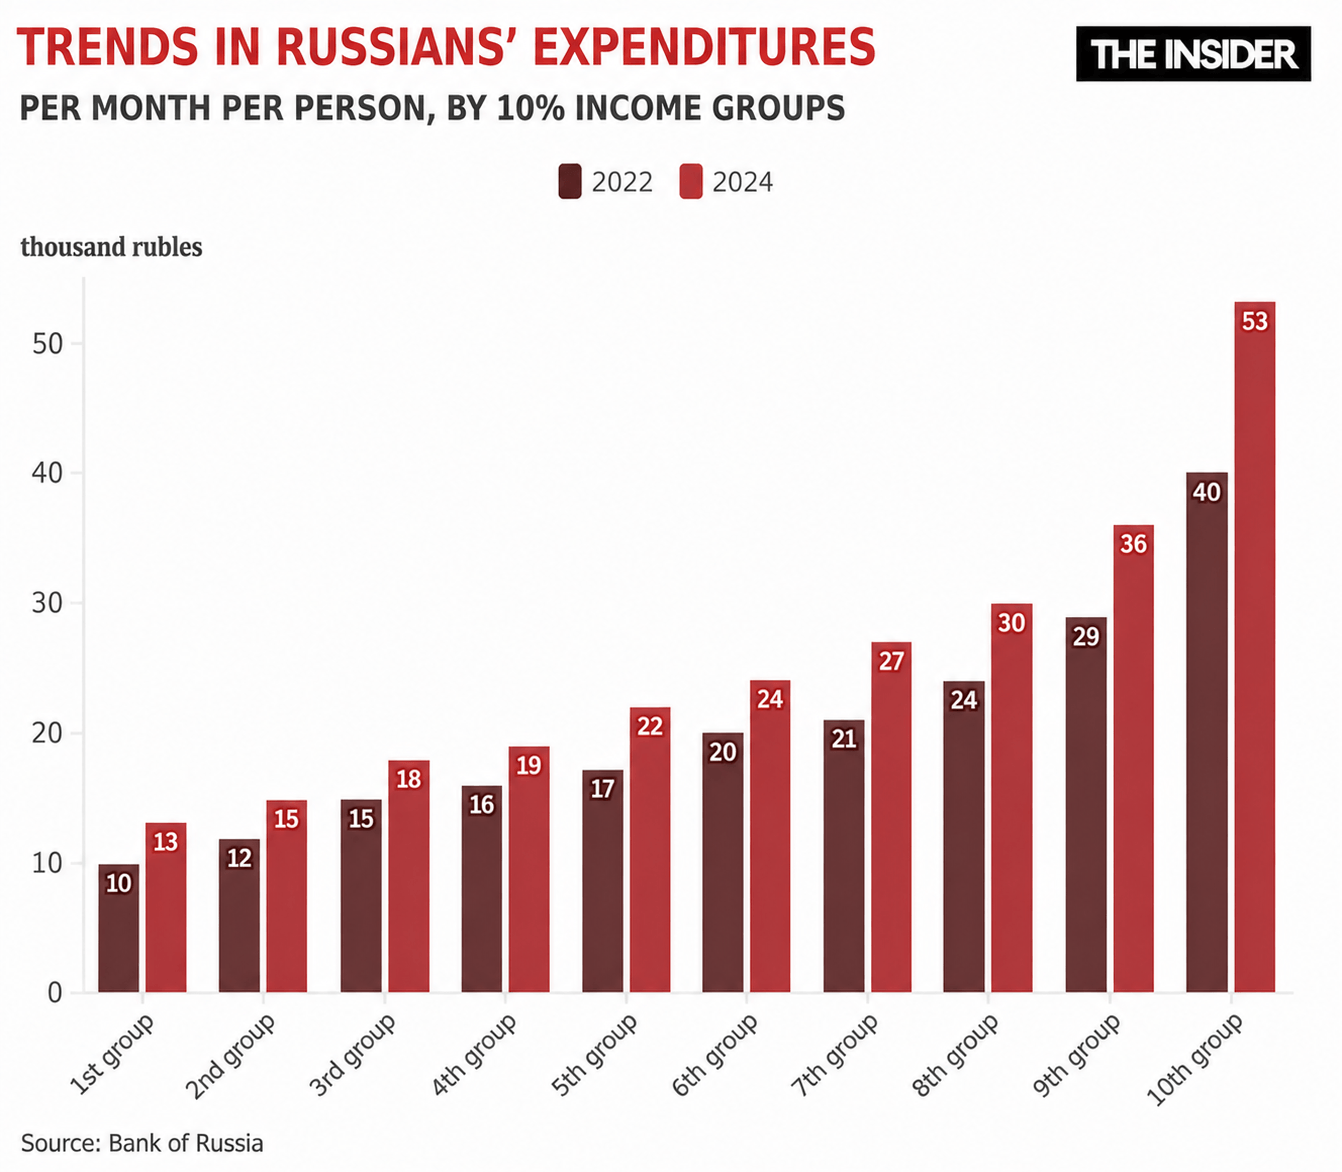
The difference is easy enough to explain: wealthy people save a significant share of their income. In 2024, only one in four households in the poorest group had savings; in the middle-income group, every second household did; and among the wealthiest 10%, three out of four households had savings. This means that three-quarters of the poorest households live without any financial cushion – any unexpected expense, illness, or job loss immediately becomes a crisis. The smaller gap in consumption is not evidence of lower inequality, but evidence that the rich have choices while the poor do not.
This reality is visible in the structure of spending itself. In the bottom six income groups, spending on food and utilities exceeds all other categories. Only in the group comprising the wealthiest 10% of households does spending on other services and non-food goods increase substantially. In other words, for six out of ten income groups, household budgets are structured in much the same way: food and utilities are the main expenses, leaving little for anything else. Only the wealthiest spend heavily on transportation, leisure, restaurants, and services.
Moreover, in the third year of the war, the poorest households began spending an even larger share of their budgets on essentials. Rosstat data show the same pattern, although using older figures: the poorest 10% spend 47.8% of all expenditures on food and another 13.9% on housing and utilities. In absolute terms, the wealthy spend 42 times more on transportation than the poor, 30 times more on leisure activities, but only three times more on food.
There is also a third dimension that is entirely absent from official Russian statistics: disparities in real estate holdings, bank deposits, and stocks. The Gini coefficient for income and consumption captures current cash flows, but not accumulated wealth. Yet assets are what determine long-term opportunities — who can afford to educate their children, who can withstand a period of unemployment, who will leave an inheritance.
According to Central Bank data for 2024, among the least affluent households median financial assets amounted to 7,000 rubles, while among the wealthiest 10% they reached 100,000 rubles — and this covers only bank accounts and deposits, without factoring in real estate and without including the super-rich, who generally do not appear in such surveys.
According to the UBS Global Wealth Report 2025, Russia and Brazil ranked first in the world for wealth inequality with a Gini coefficient for assets of 0.82 – approaching the value of 1 that represents “absolute inequality.”
How the war affects inequality
Contract servicemen receive at least 200,000 rubles a month, pushing wage benchmarks upward across the labor market. As noted by Dmitry Belousov, head of the Center for Macroeconomic Analysis and Short-Term Forecasting, “there is no doubt that after the end of the special military operation this factor will persist: military personnel and employees of the defense industry who were earning 200,000 rubles a month or more simply will not return to their previous jobs paying 50,000–60,000 rubles a month and will obviously look for work corresponding to their new social status.” Employers are already being forced to raise wages in order to retain employees who might otherwise leave for jobs at military-industrial enterprises.
Military personnel earning 200,000 rubles a month or more will not return to their “old” jobs paying 50,000–60,000 rubles a month
However, wage growth driven by non-market mechanisms comes without gains in labor productivity and increases pressure on the economy in the form of inflation. Moreover, military payments are received only by those willing to fight. Pensioners, public-sector employees, and mothers with children must all get by on their previous incomes. More importantly, where will these “veterans” go after the war ends? Most likely into the same security structures or the defense industry, rather than into education or agriculture, where wages are unlikely to rise substantially.
What does this mean for inequality? It creates an additional driver widening the gap between those benefiting from the war economy and those far removed from it. Rosstat’s new methodology, which takes the progressive tax into account – a tax that was itself introduced in 2025 in order to help fund the war – masks this growing stratification.
“It feels like serfdom”
What do Russians themselves think about the dynamics of inequality? The answer depends on who is asking the question and how it is phrased. Official polls conducted by FOM, frequently cited by state media, paint a fairly optimistic picture.
According to a survey conducted in July 2025, 87% of Russians believe the income gap between rich and the poor is large, down from 94% in 2019. Back then, 78% of respondents were convinced that the gap was widening, but by 2025 that share had fallen to 64%. At first glance, Russians themselves seem to feel that income inequality in society is gradually declining.
However, studies by independent organizations paint a much more alarming picture. For example, a survey conducted in June 2024 by the Platform Social Design Center and OnIn research group (sample size: 1,200 people) show that 53% of Russians believe social inequality in the country has increased significantly over the past five years, while only 13% said they had noticed a decline. Moreover, 37% of respondents believe the highest level of inequality in the country’s history exists in the current decade. This figure even exceeds how Russians assess social inequality during serfdom in imperial Russia in the 18th and 19th centuries (33%) and during the turbulent 1990s (23%).
The Platform study made it possible not only to measure the level of inequality, but also to understand its nature. The main cause of social stratification, according to 76% of respondents, is the inheritance of social status and privileges from generation to generation. This suggests that society views social mobility as broken and wealth not as the result of personal effort, but as an unearned advantage acquired by birth. Additionally, 57% of citizens consider the very existence of social inequality to be abnormal and something that must be fought against. Only 38% regard it as an unavoidable fact of life.
Notably, just 17% of respondents expect inequality to decline in the coming years. They believe this could be achieved through social programs, indexed payments, modernization of primary healthcare, and tax reform. At the same time, 43% believe social inequality will only intensify. They view the current situation in Russia and the instability of the global political and economic environment negatively, leading them to form a pessimistic vision of the future.

